Take this tutorial to explore the customers after completing the Configure a 360-degree view tutorial with the Customer 360 use case of the data fabric trial. The goal of this tutorial is to identify the highest value customers to target in the campaigns and determine the best rates to offer them.
The following animated image provides a quick preview of what you’ll accomplish by the end of the Customer 360 use case tutorials where you will set up and add assets to master data, map the data asset attributes, publish the data model and run matching, publish the matched data to a catalog, explore and visualize the matched data. Click the image to view a larger image.
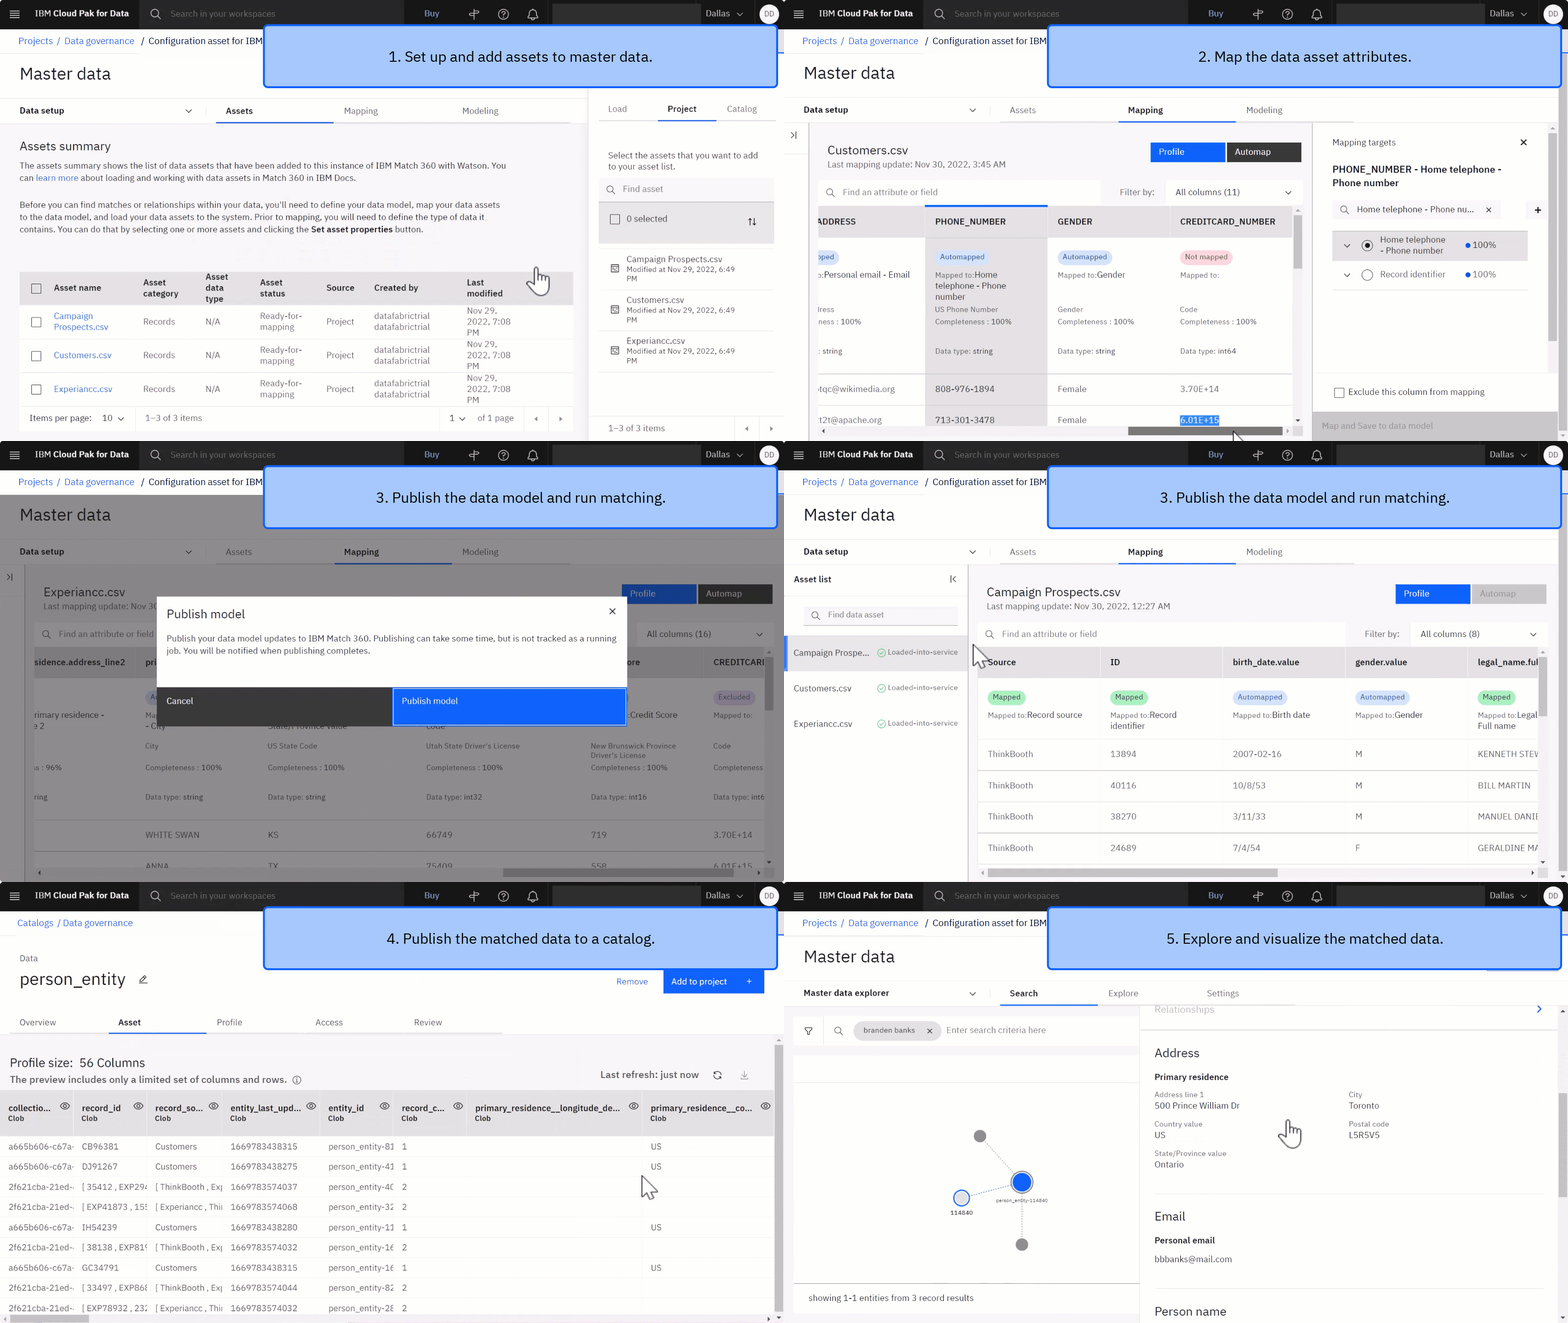
The story for the tutorial is that Golden Bank wants to run a campaign to offer lower mortgage rates. The data engineer combines customer data with credit score data to resolve entities across the data and creates a consolidated 360 view of customers. As a data analyst, you must analyze, explore, and validate IBM Match 360 results to identify and select the best qualifying customers to target formarketing campaign offers.
Tech preview This is a technology preview and is not yet supported for use in production environments.
In this tutorial, you can complete the following tasks:
- Preview your matched data.
- Tune matching algorithm and run matching.
- Gain insight on the matching results.
- Visualize records of entities.
- Cleanup (Optional)
If you need help with this tutorial, ask a question or find an answer in the Cloud Pak for Data Community discussion forum.
Preview the tutorial
 Watch this video to preview the steps in this tutorial. There might be slight differences in the user interface shown in the video. The video is intended
to be a companion to the written tutorial.
This video provides a visual method as an alternative to following the written steps in this documentation.

-
Watch this short video to see how to use the video picture-in-picture and table of contents.
Prerequisites
Complete the Configure a 360-degree view tutorial
 To preview this task, watch the video beginning at 00:35.
Complete the Configure a 360-degree view tutorial to get the neccessary data to explore.
Task 1: Preview your matched data
 To preview this task, watch the video beginning at 00:57.
Now that you published your model or data changes to IBM Match 360, set your matching parameters, and run matching, you can use master data explorer to query your matched data. The master data explorer empowers you to find, view, compare, and edit matching results. Follow these steps to explore and tune your matched data.
-
From the Cloud Pak for Data navigation menu
, choose Data > Master data.
-
Click Search master data.
-
In the search bar, type
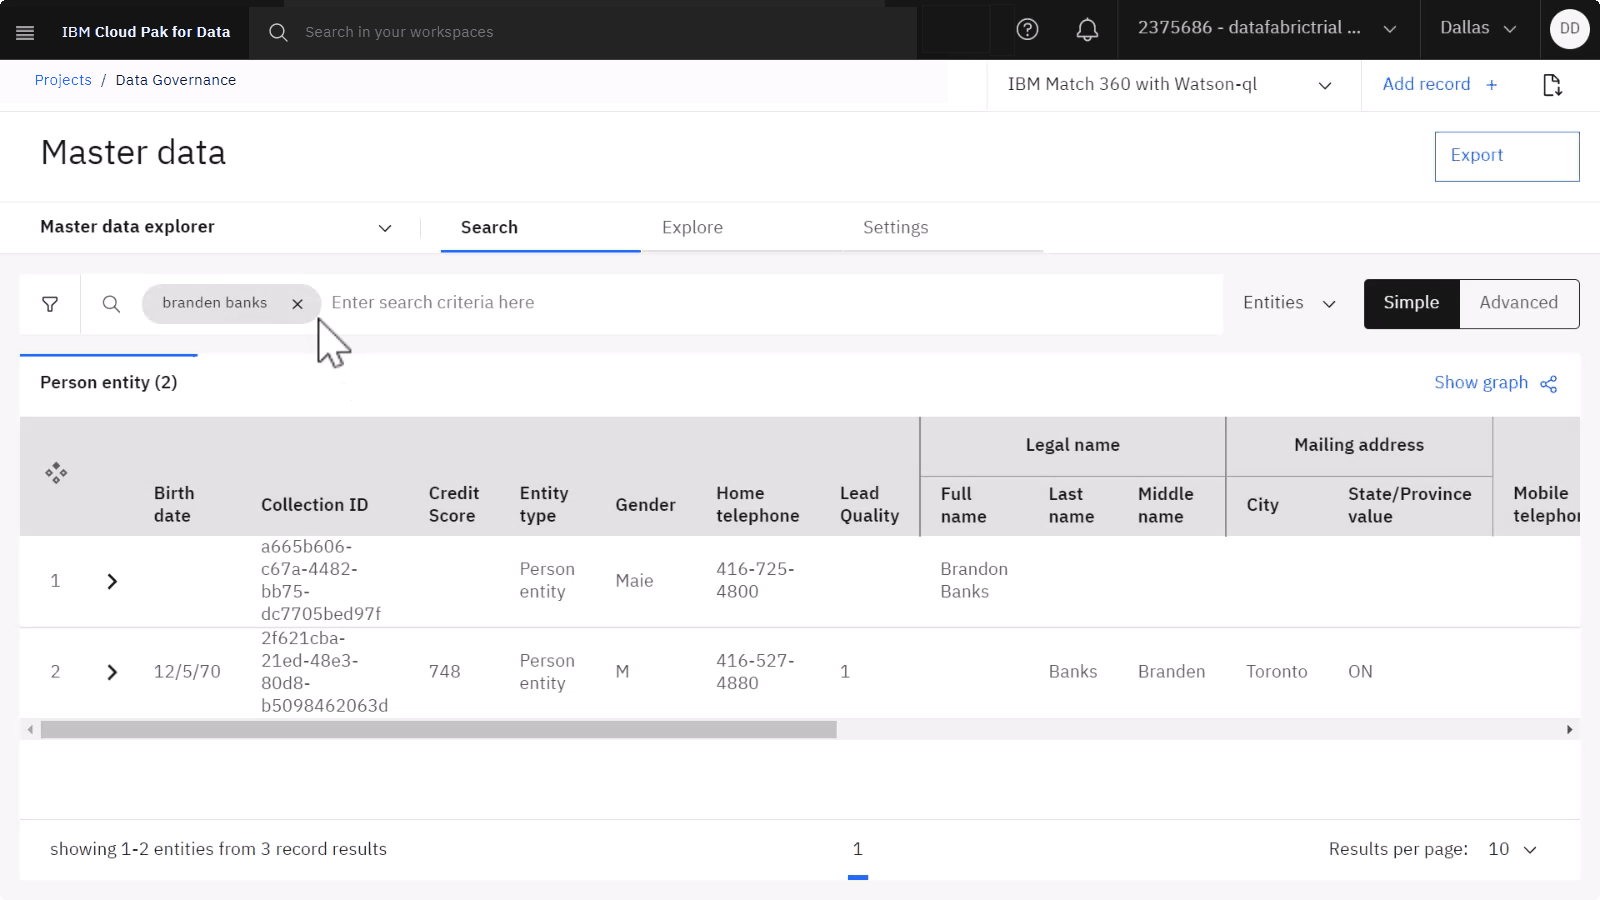
Branden Banks, and press Enter to add Branden Banks as a search criteria. For this search query, 2 entities appear for Branden Banks. The number 2 in the first column indicates that two source records that make up this entity and the number 1 in the first column means that one source record makes up the other entity. -
Click the arrow icon to expand both of the entities. You can see that these separate entities for Branden Banks is likely just one person. To join these entities into a single entity, you can tune the matching algorithm.
 Check your progress
The following image shows the search results in Master data explorer. Next, you can tune the matching algorithm and run matching again.
Task 2: Tune matching algorithm and run matching
 To preview this task, watch the video beginning at 01:48.
After exploring the matched data, it is sometimes necessary to fine tune the matching algorithm and run matching again to obtain better results.
-
Click the Master data explorer drop-down, and select Matching setup from the menu.
-
Select the Algorithm tuning tab.
-
Click Autolink threshold and type
20in the text field. Reducing the threshold to 20 results in more overall matches between records across your sources. -
Click Apply threshold > Next > Run matching to run matching with your tuned algorithm.
-
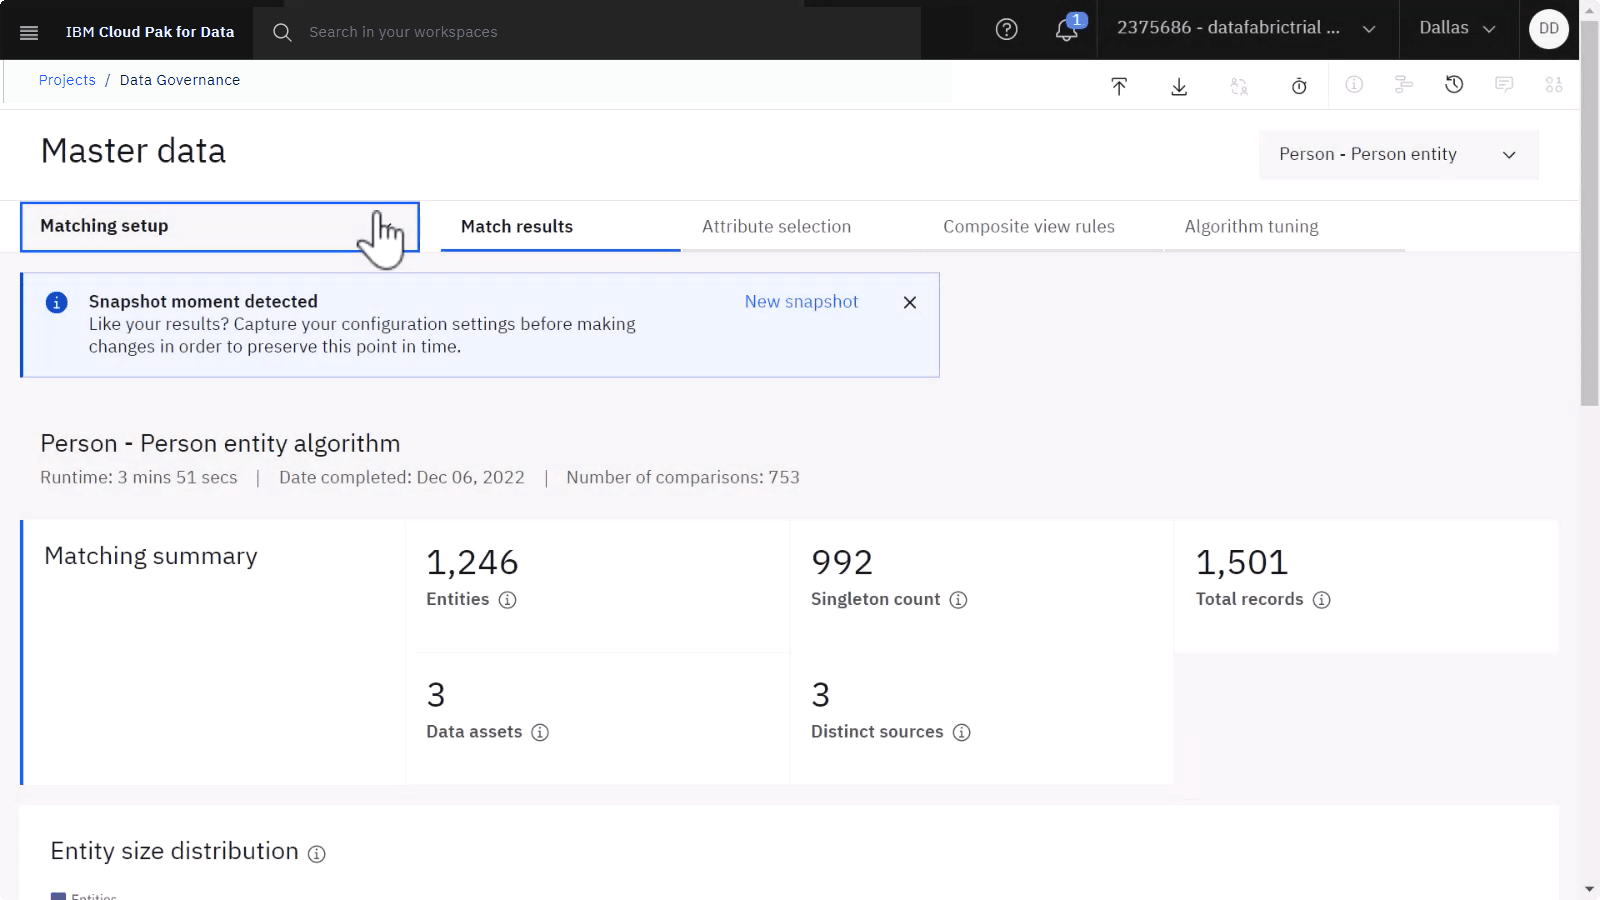
Click the Match results tab. The results are displayed when matching is finished.
 Check your progress
The following image shows the search results in Master data explorer. Next, you can view the matched data again to see how the fine tuning changed the results.
Task 3: Gain insight on the matching results
 To preview this task, watch the video beginning at 02:16.
You can return to the master data explorer to see how algorithm tuning changed your match results.
-
Click the Matching setup drop-down, and select Master data explorer from the menu.
-
In the search bar, type
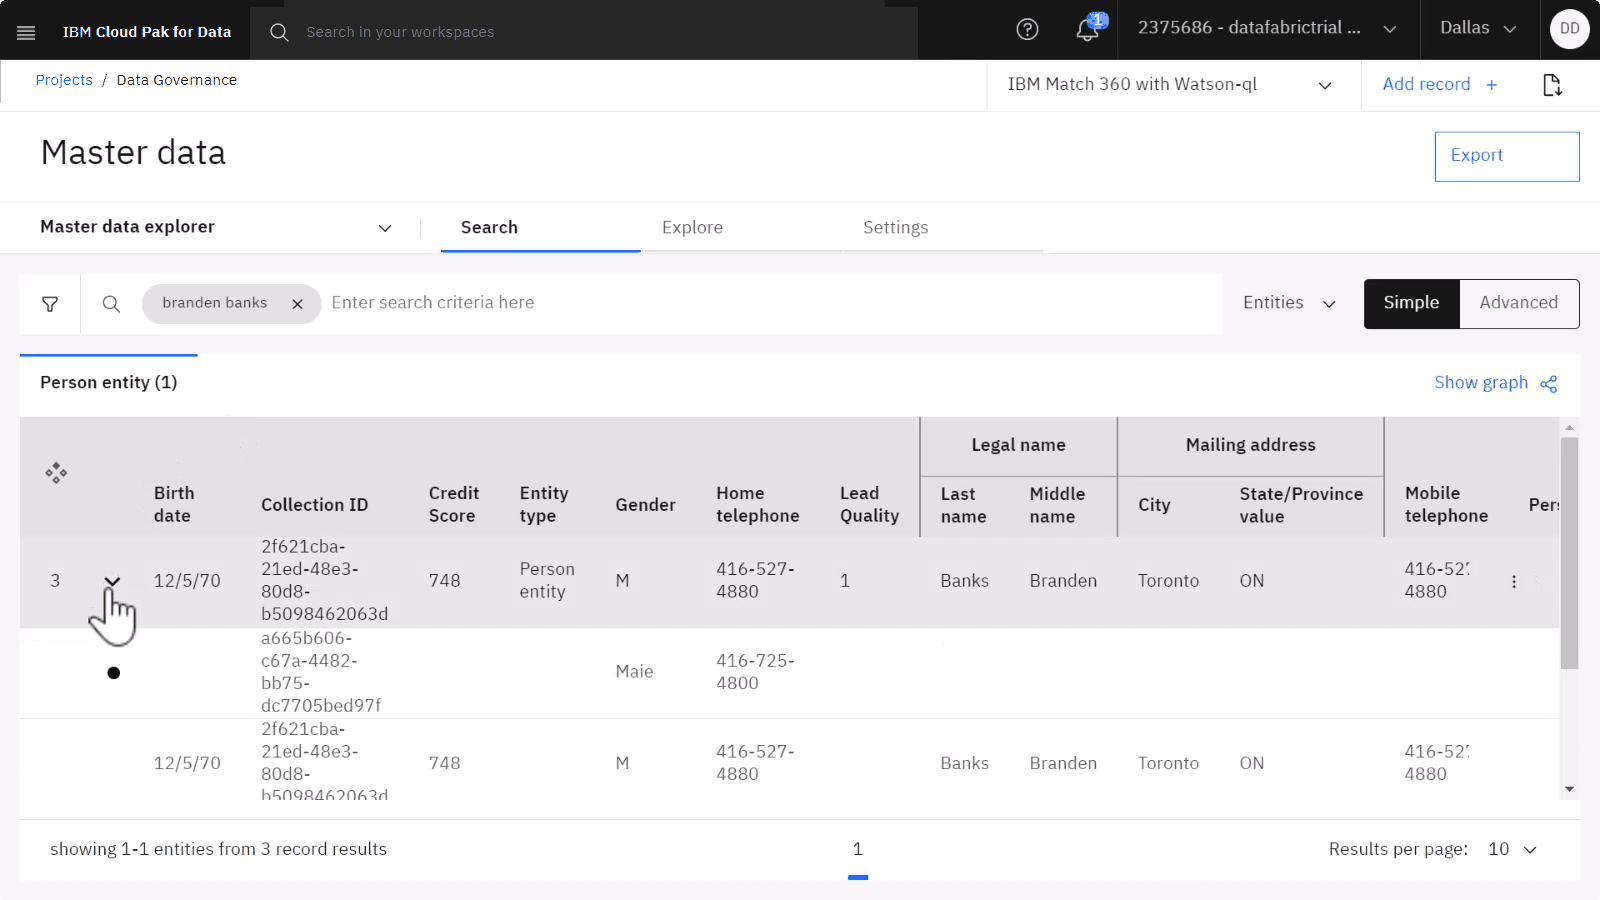
Branden Banks, and press Enter to add Branden Banks as a search criteria. The number 3 associated with the entity that is displayed means that three records make up the entity Branden Banks wheras before it was split up across separate entities. -
Expand the row in the first column of the entity to view the records. You can see the three records that were matched to this entity.
 Check your progress
The following image shows the search results in Master data explorer. Next, you can gain insight by visualizing the matching results.
Task 4: Visualize records of entities
 To preview this task, watch the video beginning at 02:45.
You can also visualize your tuned matching results the results as nodes to gain insights.
-
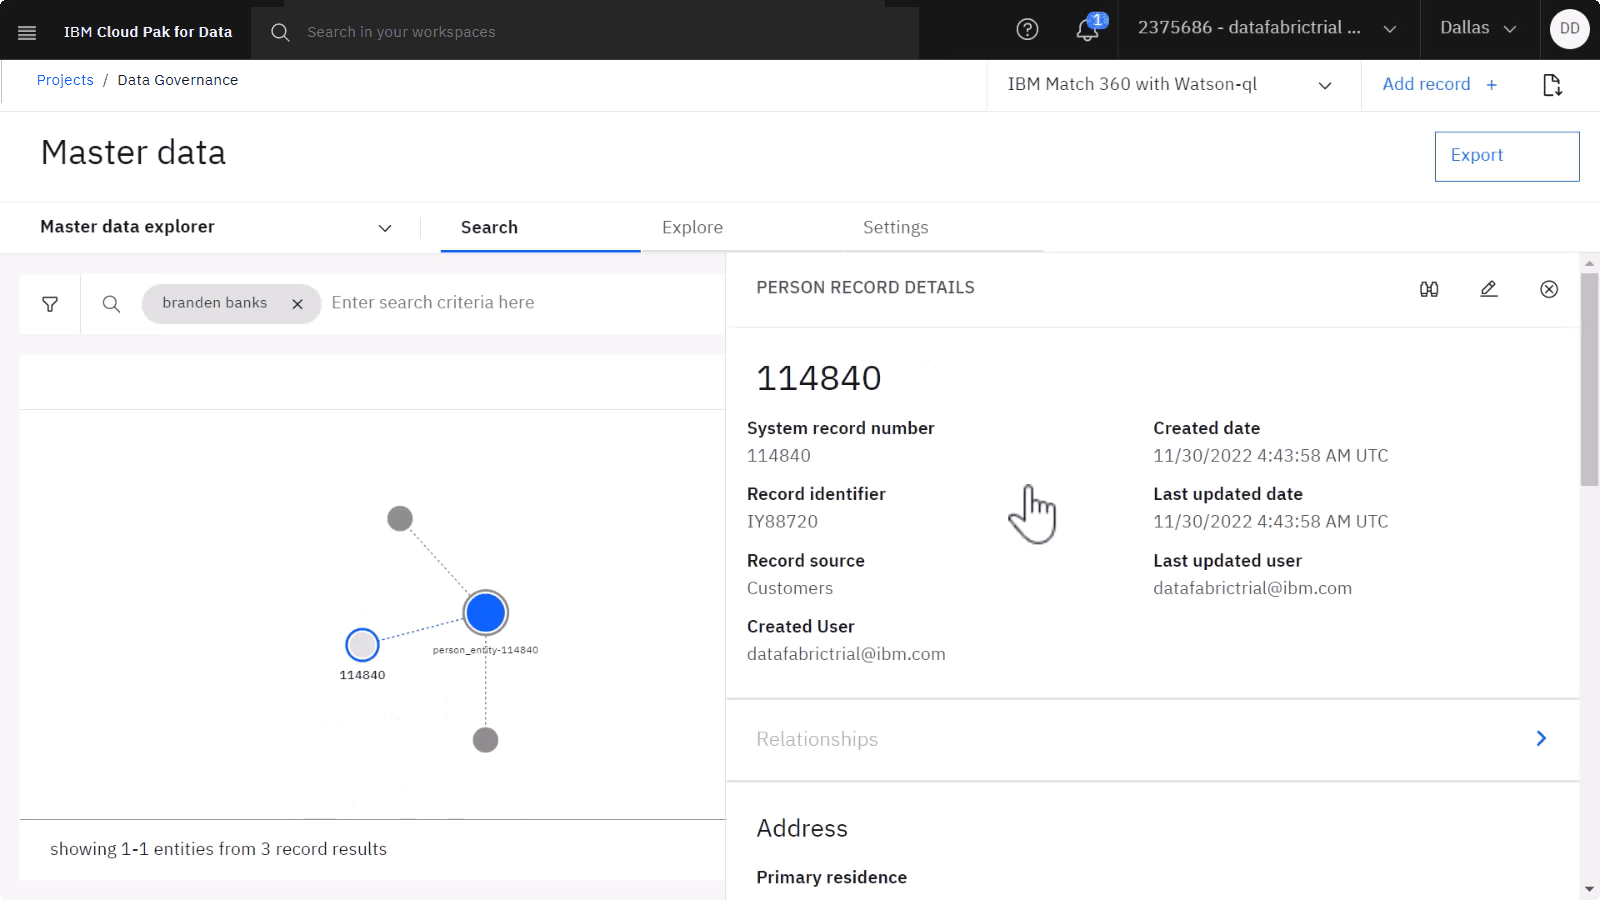
Click Show graph to see which records are contributing to queried entities.
-
Click any of the nodes that are connected to the person entity to view the details associated with it. From here, you can visualize and manually modify which records are associated which each entity from your query to make corrections as needed.
 Check your progress
The following image shows the search results as a graph.
As a data analyst, you analyzed, explored, and validated IBM Match 360 results to identify and select the best qualifying customers to target formarketing campaign offers.
Cleanup (Optional)
If you would like to retake the tutorials in the Customer 360 use case, delete the following artifacts.
| Artifact | How to delete |
|---|---|
| Customer 360 Catalog | Delete a catalog |
| Customer 360 sample project | Delete a project |
Next steps
-
Sign up for another Data fabric use case.
Learn more
Parent topic: Data fabric tutorials
