Explaining model transactions
Explanations for your model transactions help you understand how predictions are determined.
You can analyze local explanations to understand the impact of factors for specific transactions or analyze global explanations to understand the general factors that impact model outcomes. The type of model that you configure determines the type of explanation that you can use to analyze your transactions.
Explanations are supported for structured, image, and unstructured text models. Structured models can use binary, multiclass, or regression classification problems. Image or unstructured text models can use binary or multiclass classification problems.
When you configure explainability, you can use Local Interpretable Model-Agnostic Explanations (LIME), contrastive explanations, or Shapley Additive explanations (SHAP) to analyze transactions.
LIME identifies which features are most important for a specific data point by analyzing up to 5000 other close-by data points. In an ideal setting, the features with high importance in LIME are the features that are most important for that specific data point.
Contrastive explanations calculate how many values need to change to change the prediction or maintain the same prediction. The factors that need the maximum change are considered more important, so the features with the highest importance in contrastive explanations are the features where the model is least sensitive. For contrastive explanations, the maximum changes for the same outcome and the minimum changes for a changed outcome are displayed. These categories are also known as pertinent positive and pertinent negative values. These values help explain the behavior of the model in the vicinity of the data point for which an explanation is generated.
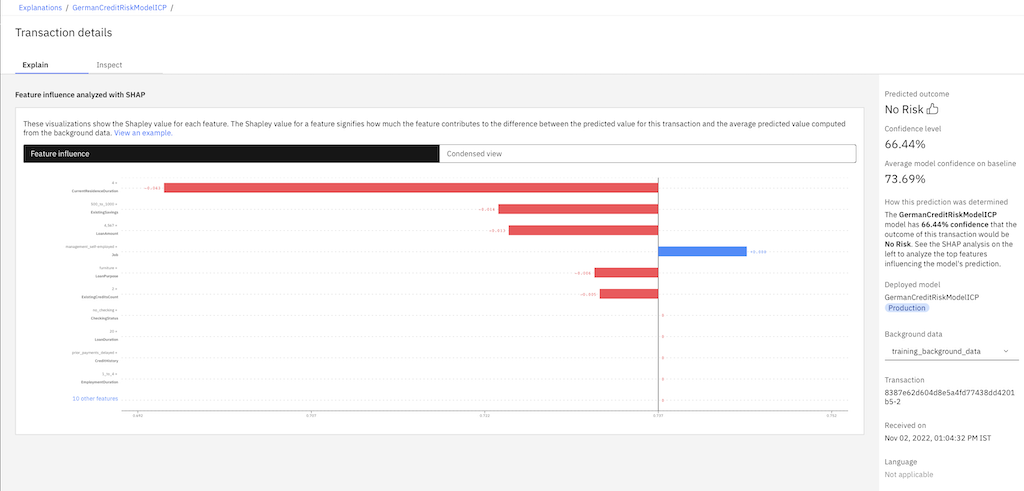
SHAP is a game-theoretic approach that explains the output of machine learning models. It connects optimal credit allocation with local explanations by using Shapley values and their related extensions. SHAP assigns each model feature an importance value for a particular prediction, which is called a Shapley value. The Shapley value is the average marginal contribution of a feature value across all possible groups of features. The SHAP values of the input features are the sums of the difference between baseline or expected model output and the current model output for the prediction that is being explained. The baseline model output can be based on the summary of the training data or any subset of data that explanations must be generated for. The Shapley values of a set of transactions can be combined to get global explanations that provide an overview of which features of a model are most important.
Only global explanations for online subscriptions are supported. SHAP explanations only support tabular data.
Analyzing local explanations
You can use different methods to view local explanations.
When you review evaluation results, you can select the Number of explanations link to open the Select an explanation window.
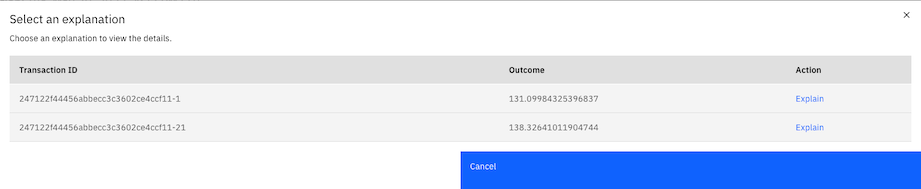
In the Action column select Explain to display the Transaction details page. The Transactions details provides different explanations, depending on which explanation methods and model types that you use.
For categorical models, on the Explain tab, the Transaction details page provides an analysis of the features that influenced the outcome of the transaction with the local explanation method that you use. For SHAP, you can select the background data that you use in the Background data menu to regenerate the explanation.
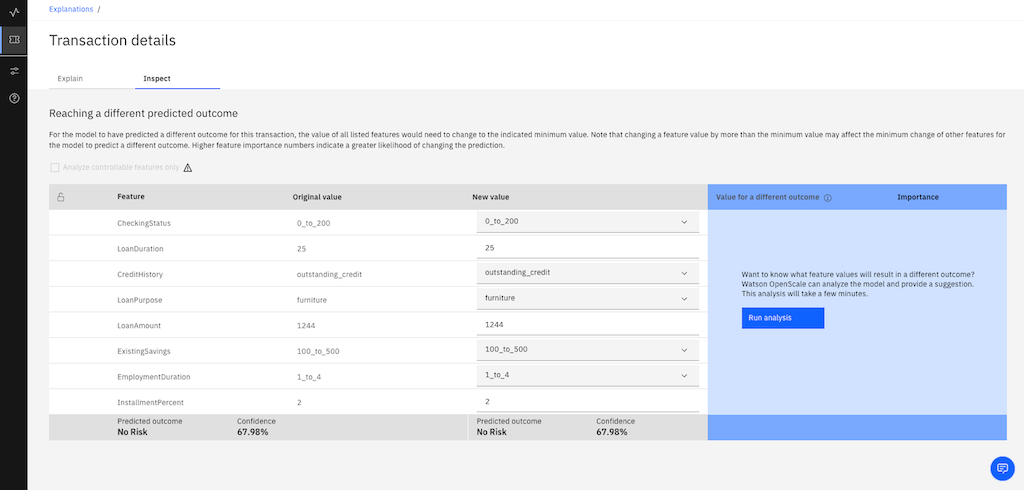
On the Inspect tab, advanced contrastive explanations are generated for binary classification models that you can use to experiment with features by changing the values to see whether the outcome changes.
You can also view different explanations for the following type of transactions:
- Explaining image transactions
- Explaining unstructured text transactions
- Explaining tabular transactions
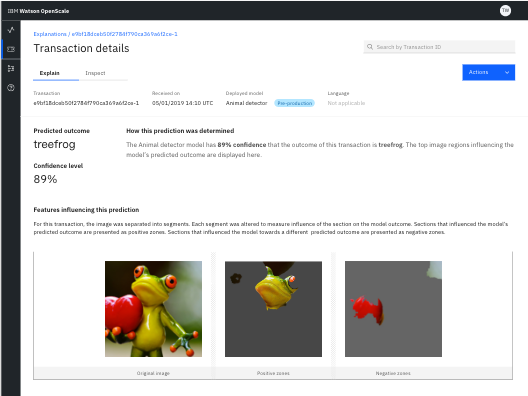
Explaining image transactions
For image models, you can view which parts of an image contribute positively and negatively to the predicted outcome. In the following example, the image in the positive panel shows the parts which impacted positively to the prediction. The image in the negative panel shows the parts of images that had a negative impact on the outcome.
You can also use the following notebooks to generate explanations for image models:
Explaining unstructured text transactions
For unstructured text models, you can view which keywords had a positive or a negative impact on the model prediction. Unstructured text models explain the importance of words or tokens.
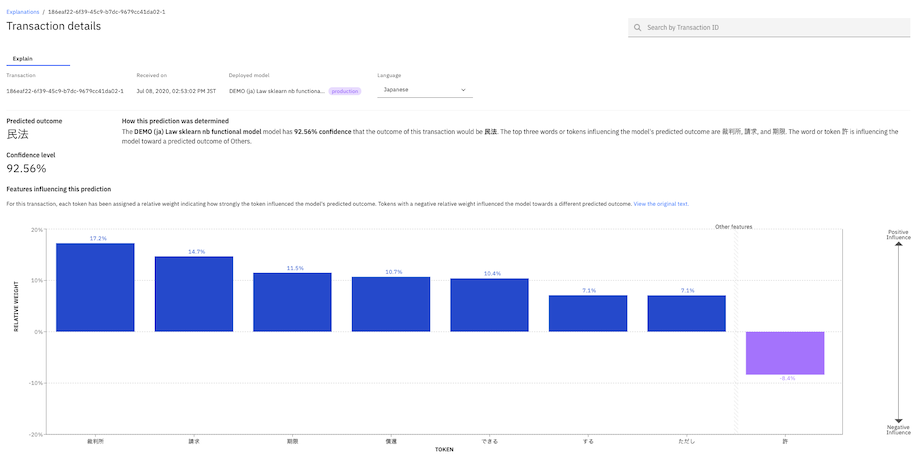
The explanation also shows the position of the identified keywords in the original text that was fed as input to the model. To change the language, select a different language from the list. The explanation runs again by using a different tokenizer.
You can also use the following notebook to generate explanations for unstructured text models:
Tutorial on generating an explanation for a text-based model
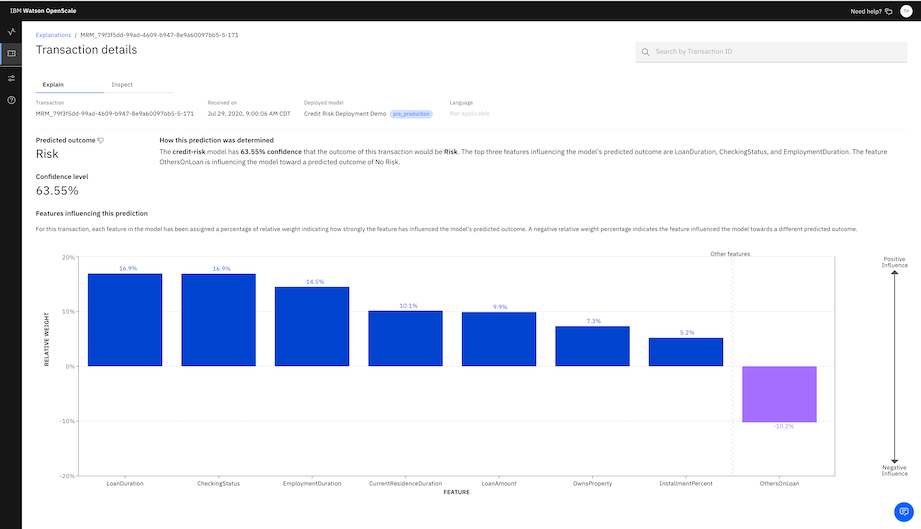
Explaining tabular transactions
For tabular classification models, you can view the top three features that positively influence the model prediction and the top three features that negatively influence the prediction.
To view local explanations, you can also select the Explain a transaction tab  to open the Recent transactions page. The page displays all of the transactions that are processed by your model.
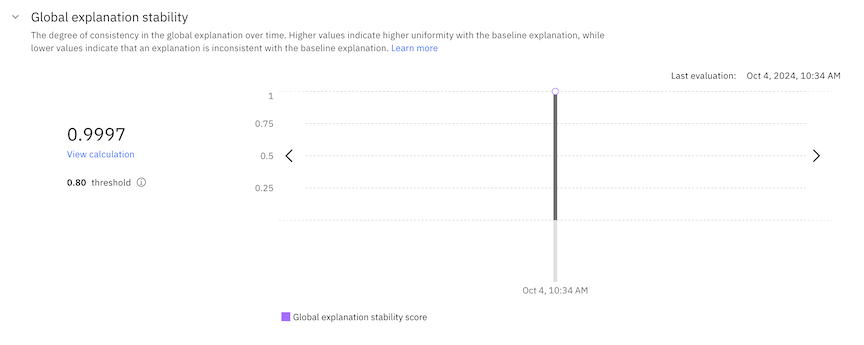
Analyzing global explanations
If you enable the SHAP or LIME global explanation method when you configure explainability, you can view details for the global explanation stability metric. The global explanation metric calculates the degree of consistency in the global explanation over time.
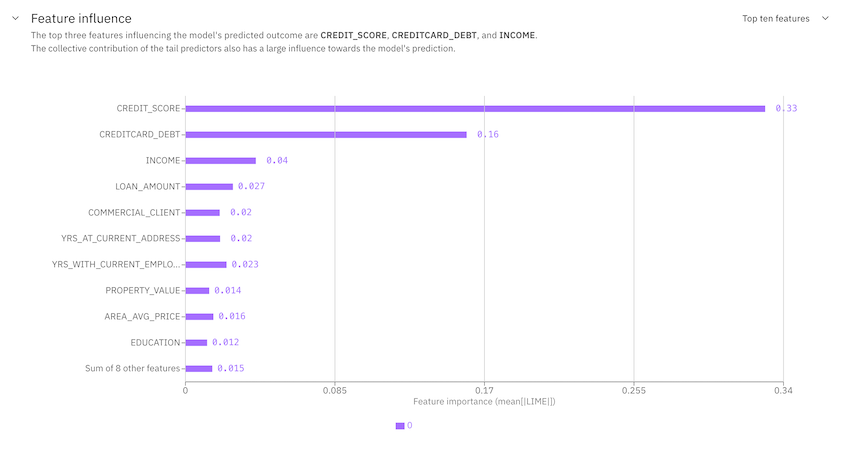
When you analyze global explanations, you can also view the following details:
Feature influence
You can view the most important features in descending order of the average absolute SHAP or LIME values to understand which features have the highest influence on model predictions.
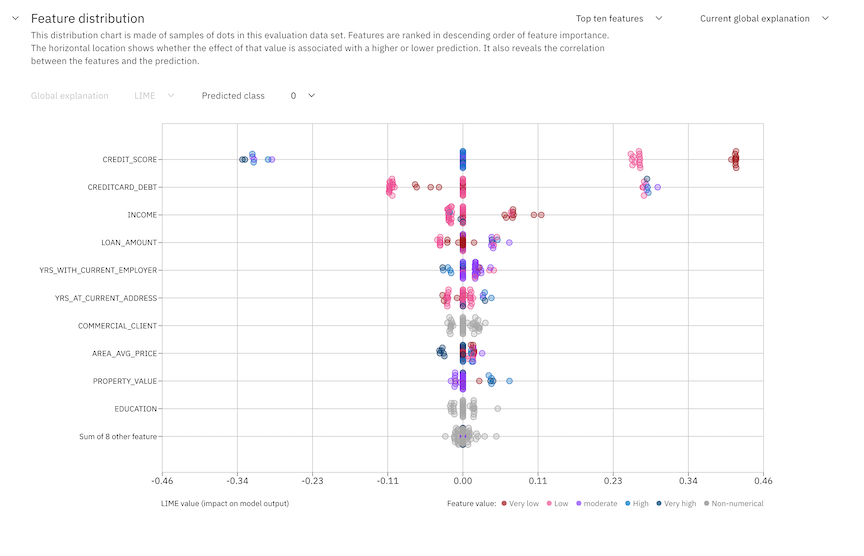
Feature distribution
The feature distribution chart shows how the SHAP or LIME values affect the predictions of the most important features. You can use the chart to understand the correlation between features and predictions.
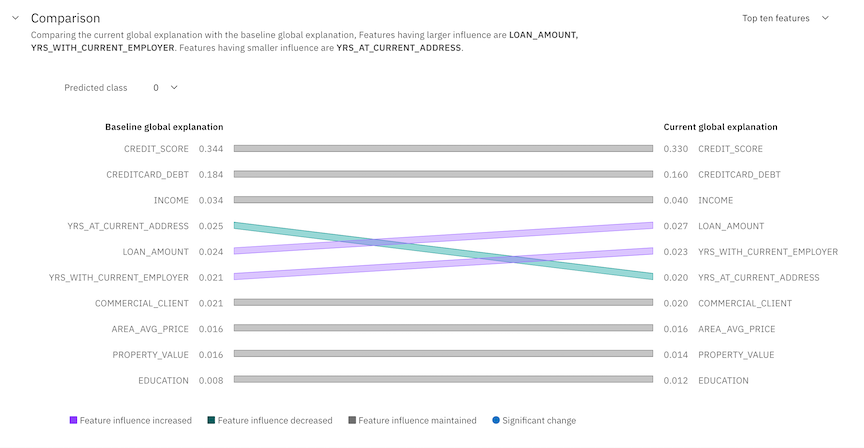
Comparison
You can view a comparison of the changes in feature influence between current global and baseline global explanations
Parent topic: Reviewing model transactions